432Views 0Comments

End-to-end analytics is a method of analysis that allows you to measure the effectiveness of your marketing investment by tracking the entire customer journey: from ad views to sales and repeat orders. Cross-cutting analysis aggregates data from all advertising channels and shows how much you’ve earned through each of them.
The more channels, touchpoints and decision times you have, the harder it is to implement end-to-end analytics.
End-to-end analytics shows the real picture of marketing effectiveness: which advertising channels and sources are generating sales. It’s useful for marketers to understand how to plan the budget, which channels to engage to maximise profits.
How it works?
The basic principle is as follows: each advertising channel should lead to landing pages with additional information in UTM tags. In this way, the user’s click-through is informative, which helps us understand which advertising channels are working and which are wasting money.

Cross-cutting business analytics is usually implemented in e-commerce or other businesses where a service or product is purchased online. For projects combining online orders and offline visits, this is a feasible but time-consuming task.
Why do you need end-to-end analytics
Let’s say marketer Vasya has launched advertising campaigns in Yandex Direct, Google Ads and VKontakte. The requests are coming in, and the sales department is reporting orders. But how do you know where the customer came from? Which channel brought in revenue for the business?
Setting up end-to-end analytics helps solve many business and marketing challenges:
- Evaluate the effectiveness of marketing channels.
- Redistribute the advertising budget to reduce the cost of attracting a customer, and increase the number of sales.
- Understand the entire sales cycle: from keyword to in-store checkout amount.
- Save time in making decisions on managing advertising costs, scaling campaigns and selecting promotion channels.
With the help of end-to-end analytics, you can more accurately evaluate the effectiveness of advertising channels and make better decisions based on the information you receive.
When you do not need end-to-end analytics
- The company has only one advertising channel.
- You can quickly calculate the profit and compare it with the investment in advertising.
- The client makes a quick decision to buy: he doesn’t go away “to think”, but buys in 1-2 visits.
- Company doesn’t keep records of how much money the client has invested in the company’s profits.
- Does not matter if the customer makes repeat purchases.
- The advertising budget is less than 500$/month.
Configuring End-to-End analytics
There are several options for implementing an end-to-end analytics system depending on the resources available, the complexity of the transaction, and the automation of processes. Let’s look at each configuration method, its features and disadvantages.
Microsoft Excel
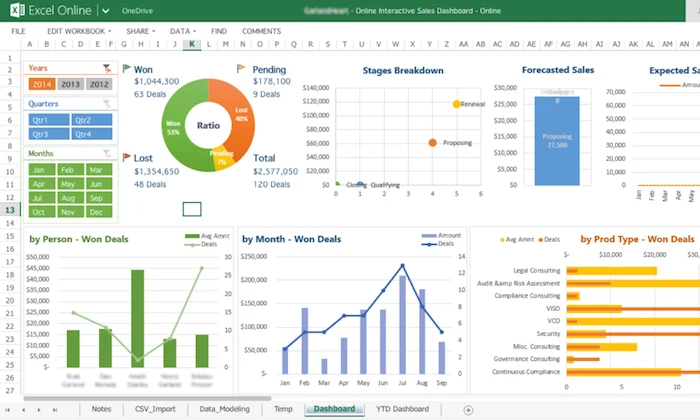
The easiest option is to start using end-to-end analytics. The essence of the method is to match advertising campaign data with sales information. Figures from advertising channels, web analytics systems (for example Google.Analytics) and CRM are uploaded into a single Excel or Google Table.
Pros
- Available to almost any business.
- Free or with a minimal investment.
Cons
- Data must be added or updated manually.
- Setting up will take time, even if the sales and advertising channels are few.
- The influence of channels on each other is not taken into account.
- Need to know formulas and Excel spreadsheets to simplify calculations.
- You may lose some customers who are not in analytics or CRM systems.
How to set up analytics in Excel:
- Gather the expenditure report for the advertising systems in Excel for a single period of time.
- Download the sales data for the same time period from the CRM or prepare an Excel spreadsheet with the sales.
- Compare the data of each visitor with the CRM data. As a result, you should have information about each customer, the date of purchase, the check, the source of the request (from which advertising channel the user came to the site or left a request). This will require knowledge of formulas and crosstabs.
The initial preparation of data for the report will also take time. However, even in Excel you can automate quite a lot of data collection (using Power Query). Or use Google Spreadsheets and the Google Apps Script platform.
Call-tracking, email-tracking and call-tracking will need to be connected, so it is not completely free of charge.
Google Analytics
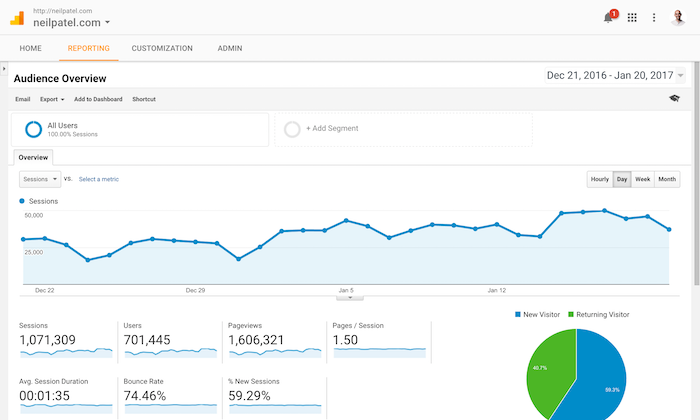
Google’s web analytics system can help create a single window for analyzing bids, spend and sales for small or medium-sized projects. This kind of performance measurement involves importing spend data from different advertising accounts into Analytics (via online connectors) and, if necessary, transferring offline purchases via Measurement Protocol.
Pros
- Suitable for small and medium-sized businesses with a small number of advertising channels.
- Free of charge.
- The system takes into account your attribution model: the impact of each advertising channel on sales, provided you have the client id of the user who placed the order, and the fact of the order is transmitted to the GA in a reasonably timely manner.
Cons
- Time consuming, requires a technical understanding of how integrations and measurement protocols work.
- Rather complicated to set up.
How to set up end-to-end analytics in Google Analytics:
- Enable the advanced e-commerce feature of Google Analytics to track the path from user visit to purchase on the site.
- Enable call-tracking (via integration) to track calls.
- set up a pass from Google Analytics Client ID (individual user ID) to the CRM system, in order to link the customer activity data on the website to the purchase path. Check with the CRM vendor to configure this feature.
- import ad spend and income data (customer purchases) into your Google Analytics report. You can do this manually each time, or set up an automatic data transfer using special software.
Setting up end-to-end analytics in Google Analytics will require time and expertise. It’s not completely free, however, and you may need to hire an external service provider to set it up.
Specialised software
All of the above methods are not automatic: they require manual updating. To implement end-to-end analytics with personal dashboards, tailored to your business area, you will need special paid software and services. Online services, which allow you to aggregate data CRM, advertising channel costs and information about visitors in one report.
Cross-cutting analytics from display to profit by channels, campaigns, ads and keywords. Generating reports for any period automatically (reports on advertisements, products, pages, regions, devices and other reports in a couple of minutes), flexible customization for personal tasks. Automatic data collection in a single report
Instead of using special services for end-to-end analytics, you can use data visualization services: Power BI, Looker, DataLens, Tableau. This is usually the most time consuming but in-depth way with more customization options for your specific business.
Pros
- Extensive automation capabilities.
- Multiple ready-to-use APIs and integrations.
- Narrow customization for each specific business.
Cons
- Such analytics services are usually paid, though inexpensive.
- Bound to a SaaS company most likely for a long time, or forever.
FAQ
How much does end-to-end analytics cost?
The price depends on several factors: number of visitors per day to the site, the number of advertising channels you use, the tool you choose and how you set it up (by yourself or with the help of a specialist or a company).
A relatively free method of setting up is to set up a report yourself in Google Charts or Google Analytics. However, even with this method you will need resources to connect additional services, time to manually update and maintain the system.
Specialized programs solve the task of auto-updating and maintaining the system’s viability. But this method will cost much more.
Who needs end-to-end analytics?
Not all companies need to implement end-to-end analytics. If a business has one source of traffic (Facebook Ads, for example), then marketing effectiveness can be evaluated through an advertising cabinet. If a business has two or more channels for getting leads, and the budget exceeds $500/month, then you should think about implementing end-to-end analytics.
Can offline data be accounted for in end-to-end analytics?
Yes, specialised software and manual design methods can include data about offline purchases. To do this, the information about offline events needs to be prepared and then uploaded to a report such as Google Analytics via Measurement Protocol. However, it is important to understand that offline data is difficult to combine with online data. The most common ways of doing this is by logging into a personal account for online orders and using loyalty cards for offline purchases.
Conclusion
- Cross-cutting analytics is a tool that aggregates data from all advertising channels and shows their effectiveness in relation to the sales they generate.
- It helps to determine which sources are generating sales.
- Transactional analytics is typically deployed in the online retail industry. It integrates offline and online orders into a single system.